
The following article summarizes the basic functionalities of the analytics tool.
Navigate from one dashboard to another
How to use the map
Apply and remove filters
Main filters and sub-filters per dashboard
Export your data
Tips & tricks
Navigate from one dashboard to another
In general, the tool offers three dashboards: Accounting, Prospecting and Sales.
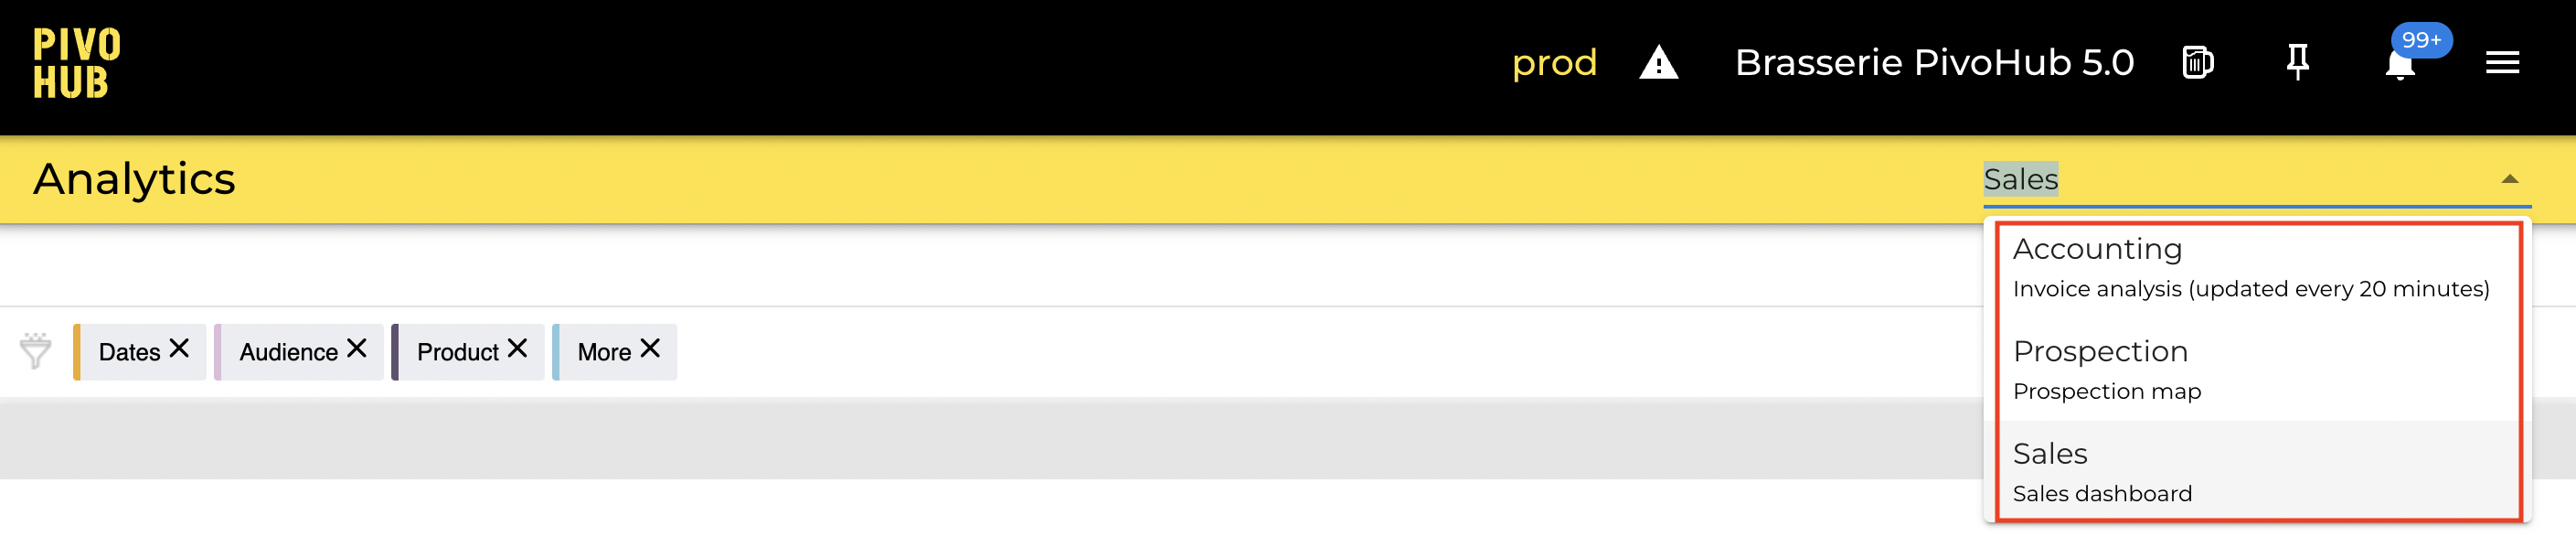
To navigate from one dashboard to another, simply open the drop-down menu by clicking on the small triangle at the top right and select the desired dashboard
The data in the Accounting dashboard will only be displayed if the 'Accounts Receivable' module has been activated and set up in the supplier account.
How to use the map
The first thing you'll see on the Sales and Prospecting dashboards is a geographic map with icons. The icons represent all the retailers who are using PivoHub. You can navigate the map by using your mouse and the + and - buttons to zoom in and out.
To view the details of a retailer, simply click on their icon.
Apply and remove filters
In order to refine your map search, you can apply a bunch of filters. Each of the dashboards contains a specific set of main filters. In addition, each of the main filters comes with several additional sub-filters with different values. To apply filters:
- check that you are in the desired dashboard
- click on the main filter of your choice
- click on the fields of the sub-filters of your choice and choose the value(s) you wish to apply
- click on the Save button.
The map will update according to the filter(s) applied.
To remove filters, simply click on the small x next to the filters you wish to remove, and save using the Save button.
.gif?width=688&name=CPT2207260833-1397x541%20(1).gif)
Main filters and sub-filters per dashboard
The following filters and sub-filters are available in the three dashboards:
Accounting Dashboard
| Main filter | Sub-filters |
| Date | Buyer |
| Region | |
| Category | |
| Subcategory | |
| Corporate Group |
| Audience | Distributor |
| Order State | |
| Groups | |
| Invoice Number |
| More | Delivered Date |
| Published Date | |
| Order Date | |
| Paid Date |
The 'Sales' dashboard
| Main filter | Sub-filters |
| Dates | Order Date |
| Delivery Date | |
| Approval Date |
| Audience | Buyer |
| Region | |
| Category | |
| Subcategory | |
| Corporate Group |
| Product | Product Name |
| Container name | |
| Style | |
| Producer | |
| Brand |
| More | Distributor |
| Order State | |
| Groups | |
| Invoice Number |
Click here to explore the most popular functionalities of the Sales dashboard.
The 'Prospection' dashboard
| Filtres principaux | Sous-filtres |
| Prospection | Permits |
| Status | |
| Client Start Date | |
| Days Since Last Order | |
| Last Order Date |
| Products (produits) | Products |
| Containers | |
| Product Categories | |
| Product Subcategories |
| Other Targeting Filters | Routes |
| Audience | Buyer |
| Region | |
| Category | |
| Subcategory | |
| Corporate Group |
Click here to explore the most popular functionalities of the Prospection dashboard.
Export your data
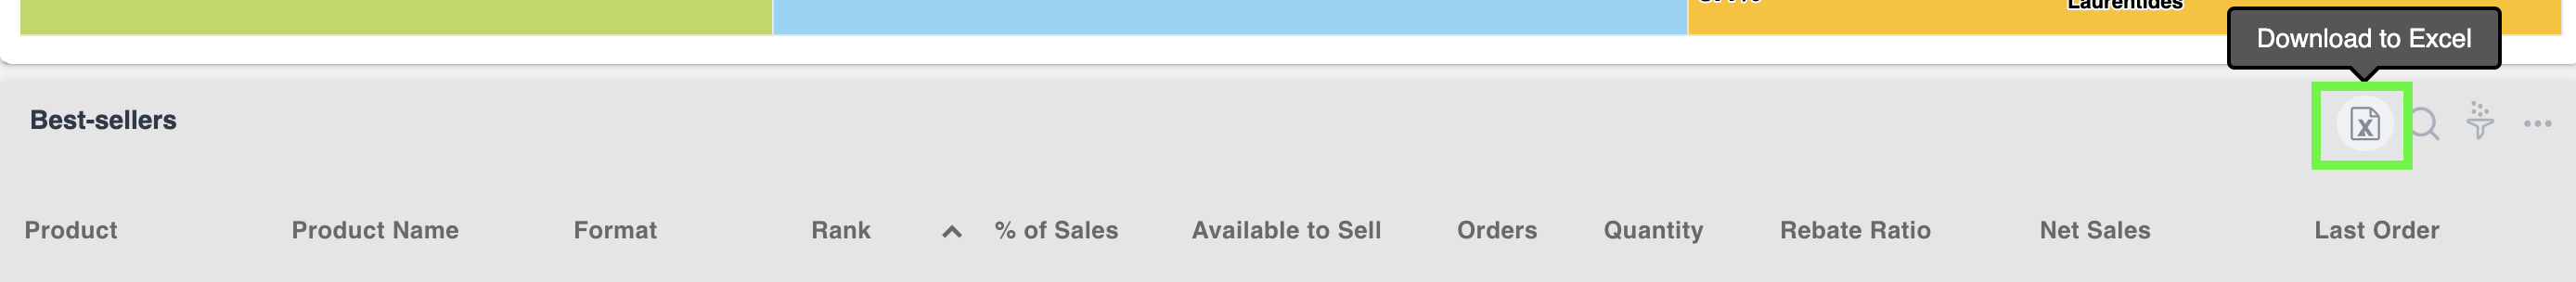
The Accounting and Sales dashboards allow you to export data in Excel format. In order to start the download of the desired data simply- hover your mouse over the section to make the Excel icon appear.
- click on the Excel icon to the right of the section containing the data you wish to export.
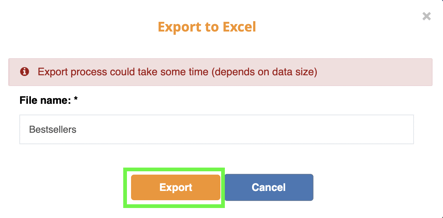
- choose a file name and click on the Export button. The file will be downloaded automatically.
Tips & tricks
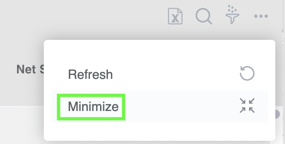
💡 Maximize and minimize the data.
In order to see all the data in its entirety, simply click on ··· , then on Maximize to the right of the data you wish to view.

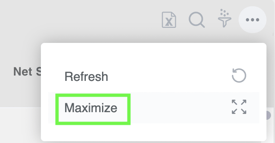
You can minimize the list of data by clicking on Minimize.
💡 Don't forget to remove the filters
The data that is displaying in the tables and sections always depends on the filter(s) you have selected. It's easy to forget that there are active filters, so check regularly to see if you need to remove an active filter in order to get the data you want. Simply click on the x next to a filter and click Save to remove one or more filters.
💡 Are you a sales director or representative? Check out our additional blog posts (in French) below for useful information:
5 façons d’utiliser le module Analytics pour les représentant·e·s des ventes
5 façons d’utiliser le module Analytics pour les directeur·trice·s des ventes
⬅️ Previous article : Introduction to the Analytics tool
➡️ Next article : Analyse your sales
.png?width=216&name=Button%20(3).png)
Or write to support@pivohub.com