
The Analytics tool allows suppliers to dynamically interact with their PivoHub data to better understand their customers and their consumption habits.
The tool provides access to three distinct dashboards: Accounting, Sales, Prospection.
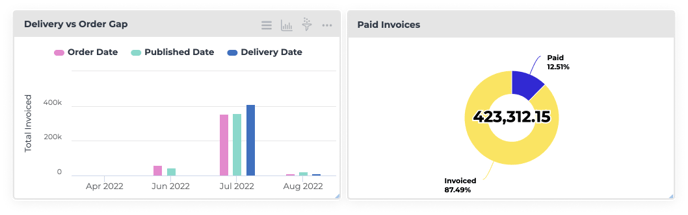
Accounting dashboard
To analyse invoices, delivery times, accounts receivable, credits and fees.
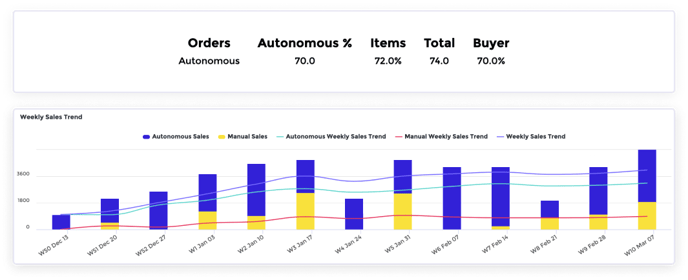
Sales dashboard
To analyse sales by product, by customer, by region, by time frame, by representative, by group, by distributor or by container type.
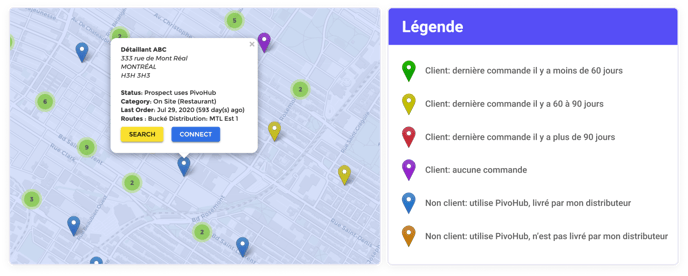
Prospection dashboard
To search for potential customers based on their region, their permits, their status, their use of the platform or the products they order.
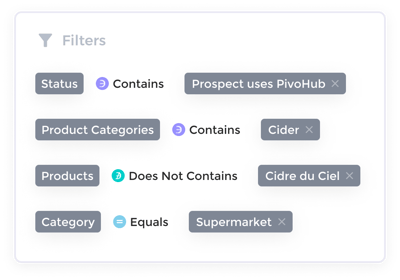
The data in these dashboards can be filtered by date, region, type of retailer, products ordered, route (and much more) to answer any question and apply the results to your sales strategies on PivoHub. As the possibilities are quite endless, the following articles offer you the most popular functionalities to start with.
How to use the tool
- Basic functionalities of the analytics tool
- Analyse your sales
- Find prospects with the Analytics tool
- F.A.Q.s & technical troubleshooting
Safari is not fully supported yet, we recommend to use Chrome or Firefox.
The displayed data is synchronized every 24 hours, except for inventory availability which is displayed in real time.
➡️ Next article : Basic functionalities of the analytics tool
.png?width=216&name=Button%20(3).png)
Or write to support@pivohub.com